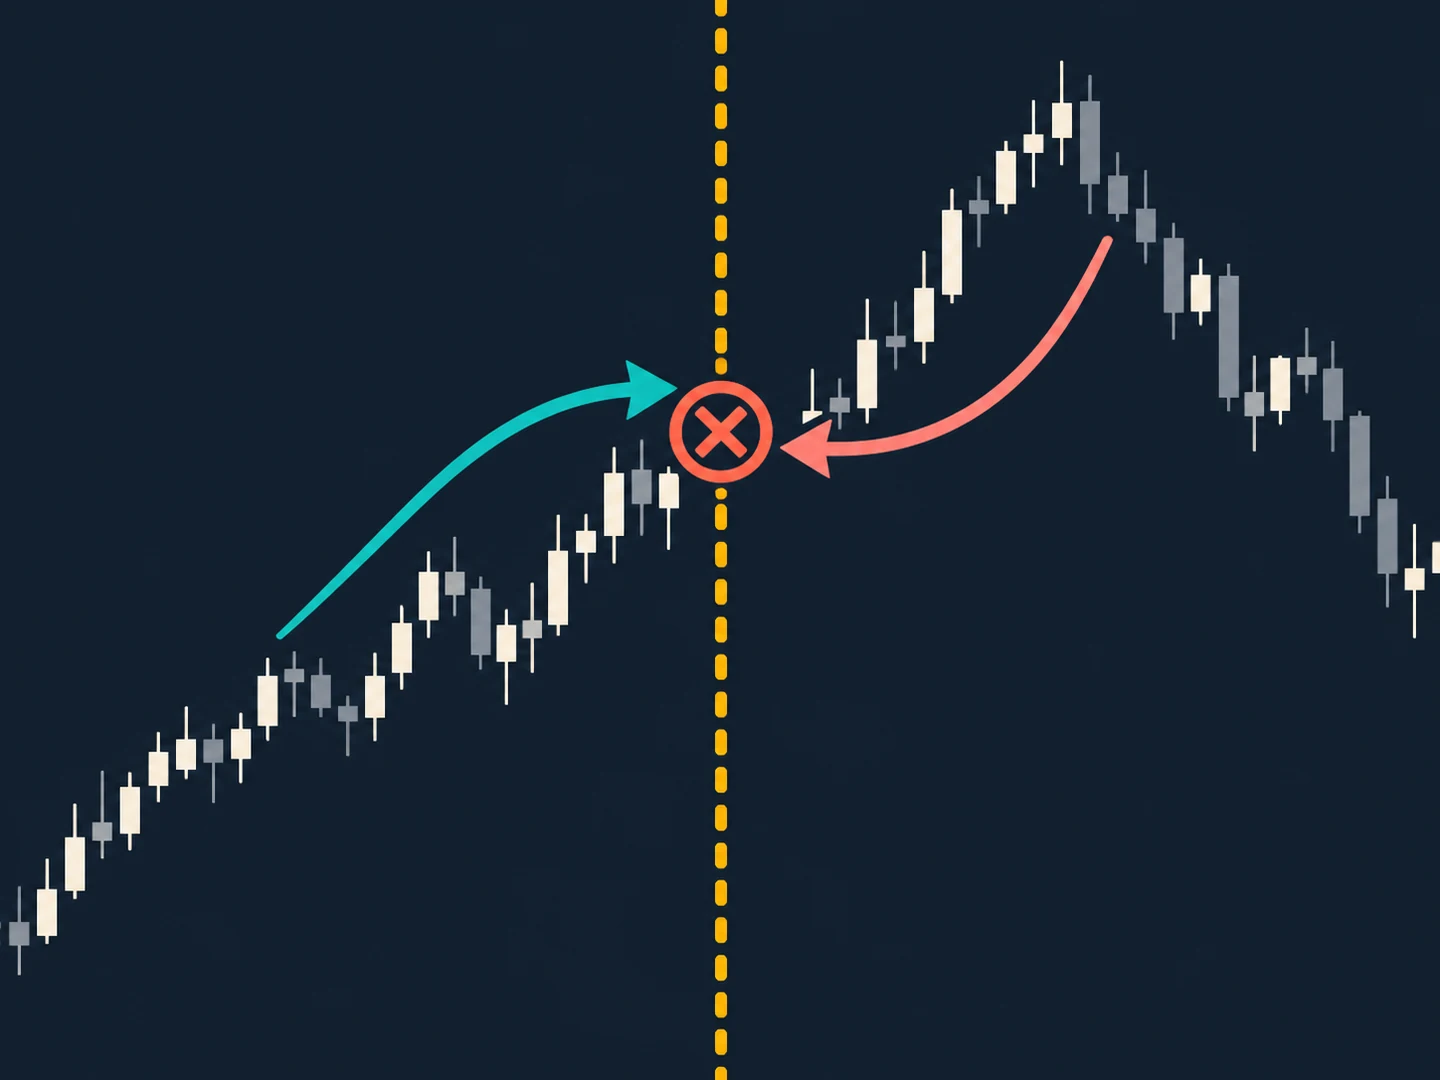
A backtest can look tidy right up to the moment costs appear. One column says gross result; another subtracts a fee; a final line reports what remains. The arithmetic may be correct and the conclusion still fragile, because a small change to spread or slippage can matter when the modeled edge is narrow.
The useful question is not whether a backtest should include costs. It should say what costs it includes, how those costs are applied, and how much the result depends on those choices. A cost model is an assumption about a simulated process, not a receipt from an actual broker.
Does a quoted price guarantee a fill?
Historical bars make price movement visible, but they do not show every detail of an order's execution. A market order generally seeks execution rather than a guaranteed price. FINRA explains that the execution price can differ from the quote seen when an order is placed, especially when prices move quickly or there is a delay. A backtest that treats every signal price as an available fill has quietly made an execution assumption, even if its report never names one.
That is why costs are more than a final deduction. The chosen entry and exit prices, order timing, and cost convention all shape the simulated result. U.S. execution disclosures distinguish quoted, effective, and realized spreads; the SEC's Rule 605 materials describe effective spread relative to the midpoint when an order is received. The terms help make execution comparisons precise, but they do not turn a bar-based simulation into a reconstruction of a particular trader's fill.
Name each cost once
Start by writing down the components your test actually models. Different venues and instruments have different fee schedules and conventions, so a generic label such as trading costs can hide more than it explains. Keep a component in one place and say whether the number applies per side, per order, or to a complete round trip.
- Explicit fees: commissions, exchange charges, or other amounts assessed by the venue or service. Record the unit and whether both entry and exit are included.
- Spread: the difference between available bid and ask prices. State whether your simulated fills already cross that spread or whether a separate spread adjustment is being applied.
- Slippage: the difference between the assumed execution price and a chosen reference or fill assumption. Define the reference and the event at which it is measured.
- Market impact or other holding costs: include them only when relevant to the modeled question, and clarify whether impact is already part of your slippage or implementation-shortfall estimate.
The accounting rule is simple: do not charge twice for the same friction. If an entry price is already modeled at the ask and an exit at the bid, then some spread cost may already be embedded. Subtracting a full spread again could overstate it. Conversely, a fill at the bar's midpoint does not become realistic just because a fee is deducted later. Define the fill convention first, then add only the costs it leaves out.
Build a fair comparison before calculating
A useful cost comparison changes a stated assumption while keeping the rest of the test legible. That lets a reviewer see whether the conclusion is driven by the rule being studied, by its data, or by the execution model attached to it. It also makes later corrections easier to document.
- Freeze the event set and rule version. Do not quietly change which observations count while comparing cost assumptions.
- Write the units. Specify the instrument or abstract unit, the size convention, the cost per side or round trip, and how partial or unfilled orders are represented.
- Separate gross from net. Preserve the pre-cost result, then show each cost component and the net result under the stated convention.
- Choose a baseline and alternatives for a reason. Use documented fee information or execution observations where they are available; if values are exploratory, say so instead of presenting them as typical.
- Apply costs consistently. Include losing and winning observations, and state how the model handles missing prices, rejected orders, and trades that would not have filled.
The point is not to find one perfect slippage number. It is to show what changes when a defensible assumption changes. If the result only looks favorable under one narrow setting, that dependence belongs in the headline conclusion, not in a note readers are unlikely to see.
A hypothetical round-trip calculation
Consider a deliberately hypothetical example with 20 abstract round trips. Suppose the simulated gross outcome averages $15 per round trip, for $300 in total. The example assumes $2 in fees, $4 in spread, and $5 in slippage per round trip. Under that convention, modeled costs are $11 per event, or $220 total, leaving a simulated net result of $80.
Now change only the hypothetical slippage assumption from $5 to $9 per round trip. Modeled costs rise to $15 per event and $300 in total; the simulated net result becomes zero. Nothing about the underlying price history changed. The exercise shows how much the summary depends on an execution input. These invented figures are only arithmetic examples, not market data, a cost estimate, or a trading recommendation.
Use sensitivity analysis as a question
A range of assumptions can be more informative than a single point estimate, provided the range has a stated rationale. A low, baseline, and higher-cost case can show where a result changes materially. The cases are not confidence intervals unless they were built and interpreted as such, and they are not probabilities of future costs.
- Vary one component at a time to see which assumption moves the output most.
- Then test a combined case if the components could plausibly change together; explain that relationship rather than stacking unrelated extremes.
- Report more than a single total where useful: net outcome, dispersion, drawdown, turnover, or the count of observations affected can answer different questions.
- Keep the rationale beside each value. If a value is a teaching placeholder rather than an observed estimate, label it plainly.
A one-input sensitivity is especially useful for spotting a break-even assumption: the modeled level at which a chosen summary changes sign or loses a stated property. That is a boundary inside the model, not a maximum cost you can expect to pay or a threshold that makes a method suitable for anyone.
What a cost-adjusted backtest cannot tell you
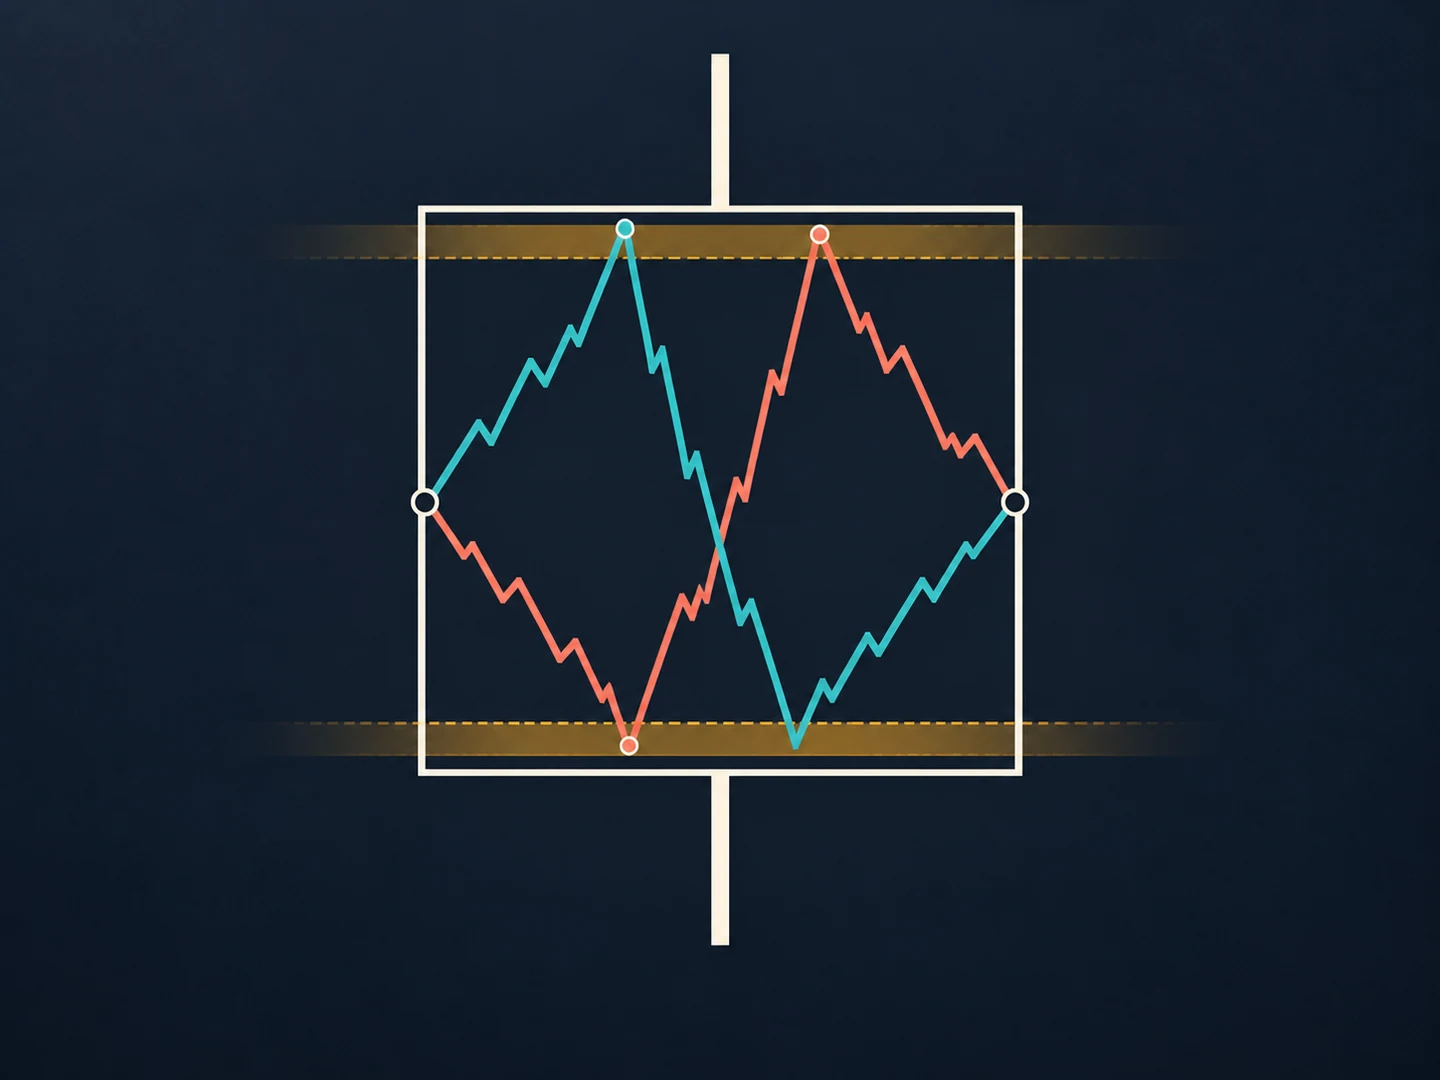
A bar-based backtest cannot recover queue position, the exact order book, latency, or the path of every trade through a candle. Even a carefully described slippage model is a simplification. Realized execution can vary with order type, size, liquidity, venue, timing, and market conditions. A model may omit some of those effects or represent them only roughly.
Those limitations are not a reason to leave costs out. They are a reason to describe the model's scope and compare alternatives. A cost-adjusted historical or simulated result is conditional on the data, rules, and execution assumptions used. It does not show what a future order will cost, and it cannot guarantee that the method would behave the same way in a different sample.
Research reaches a similar caution from another angle. Novy-Marx and Velikov's study of published equity-market anomalies found that transaction costs changed the profitability picture for strategies in their sample, with higher-turnover ideas facing a greater cost hurdle. That is evidence about the studies and assumptions they examined, not a universal estimate for every market, product, or trading method.
A practical next step
Turn the cost model into a short audit trail: list the fill convention, name each cost, state its unit, show the baseline and alternatives, and preserve the gross and net summaries together. Then a reviewer can reproduce the arithmetic and see which assumption deserves more evidence.
DayTradeDrill's manual backtesting workflow lets learners set spread, fee, and slippage assumptions as part of practice. Those inputs are training assumptions; the replay is not a broker fill model and does not establish actual execution costs. Used that way, a replay can help make assumptions visible without turning a simulated result into a claim about future performance.
The better backtest report is not necessarily the one with the most elaborate cost engine. It is the one that makes its assumptions easy to inspect, counts each source of friction once, and shows how the conclusion changes when those assumptions move. The net number matters. So does the path by which the model produced it.
- Check whether a backtest used information that was not available at the time
- See why OHLC bars can leave intrabar execution paths ambiguous
- Use stress tests as questions rather than forecasts
Sources and further reading
- Understanding Order Types Can Save Time and MoneyFinancial Industry Regulatory Authority (FINRA)
- Disclosure of Order Execution and Routing PracticesU.S. Securities and Exchange Commission
- Transaction Cost Analysis for FuturesCME Group
- A Taxonomy of Anomalies and Their Trading CostsThe Review of Financial Studies