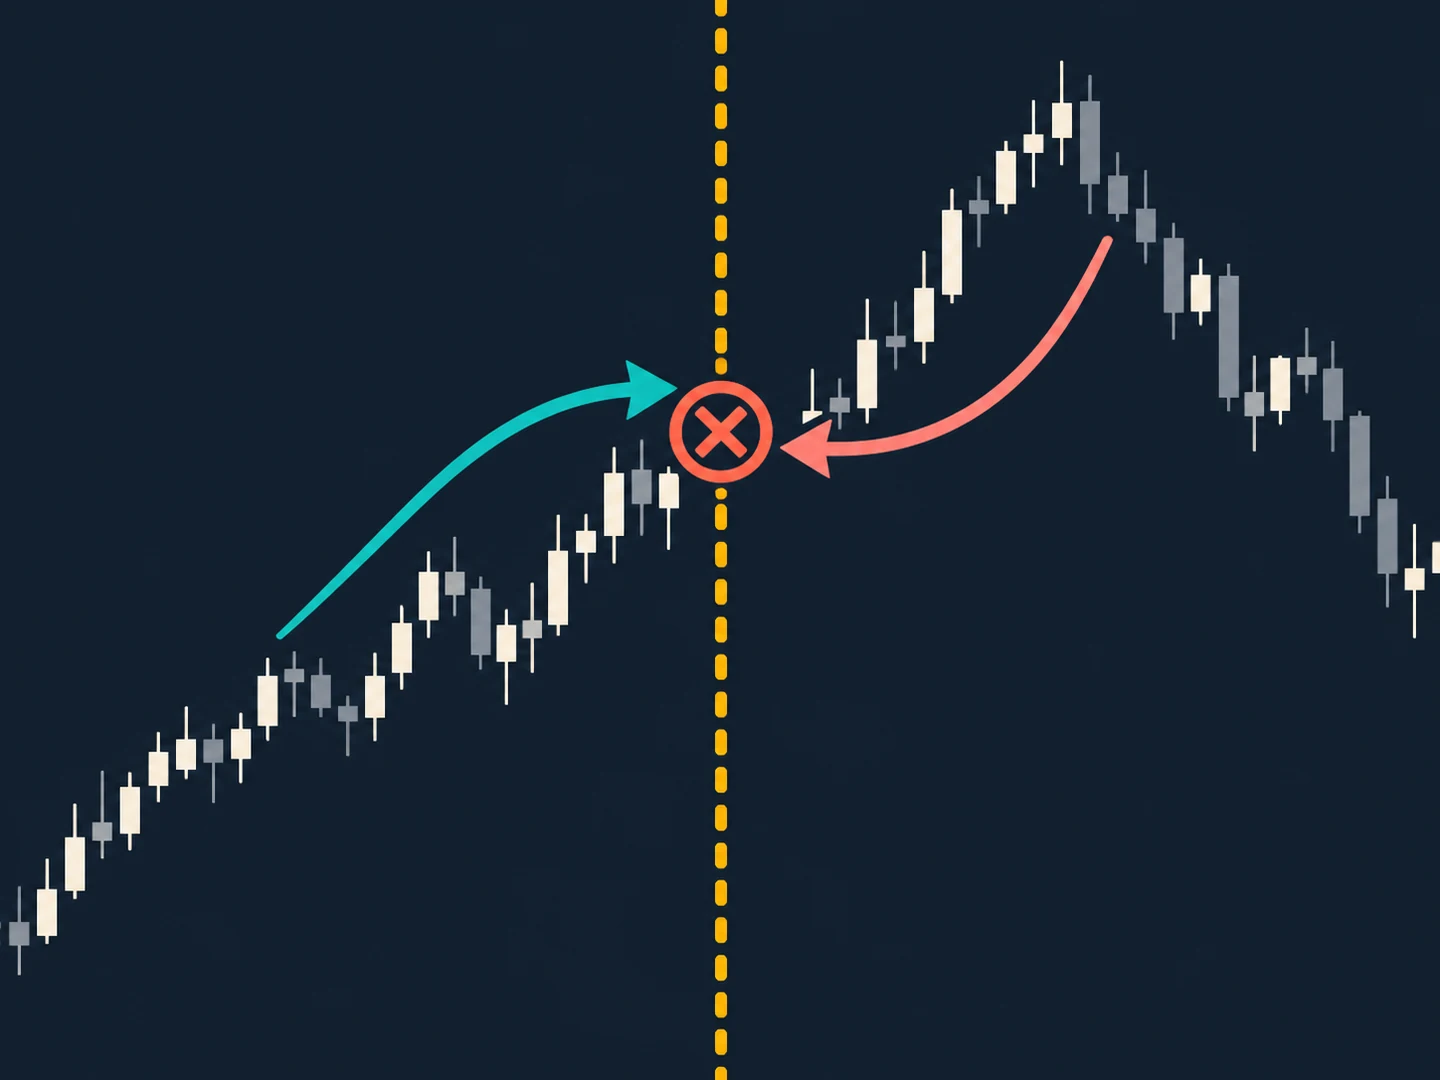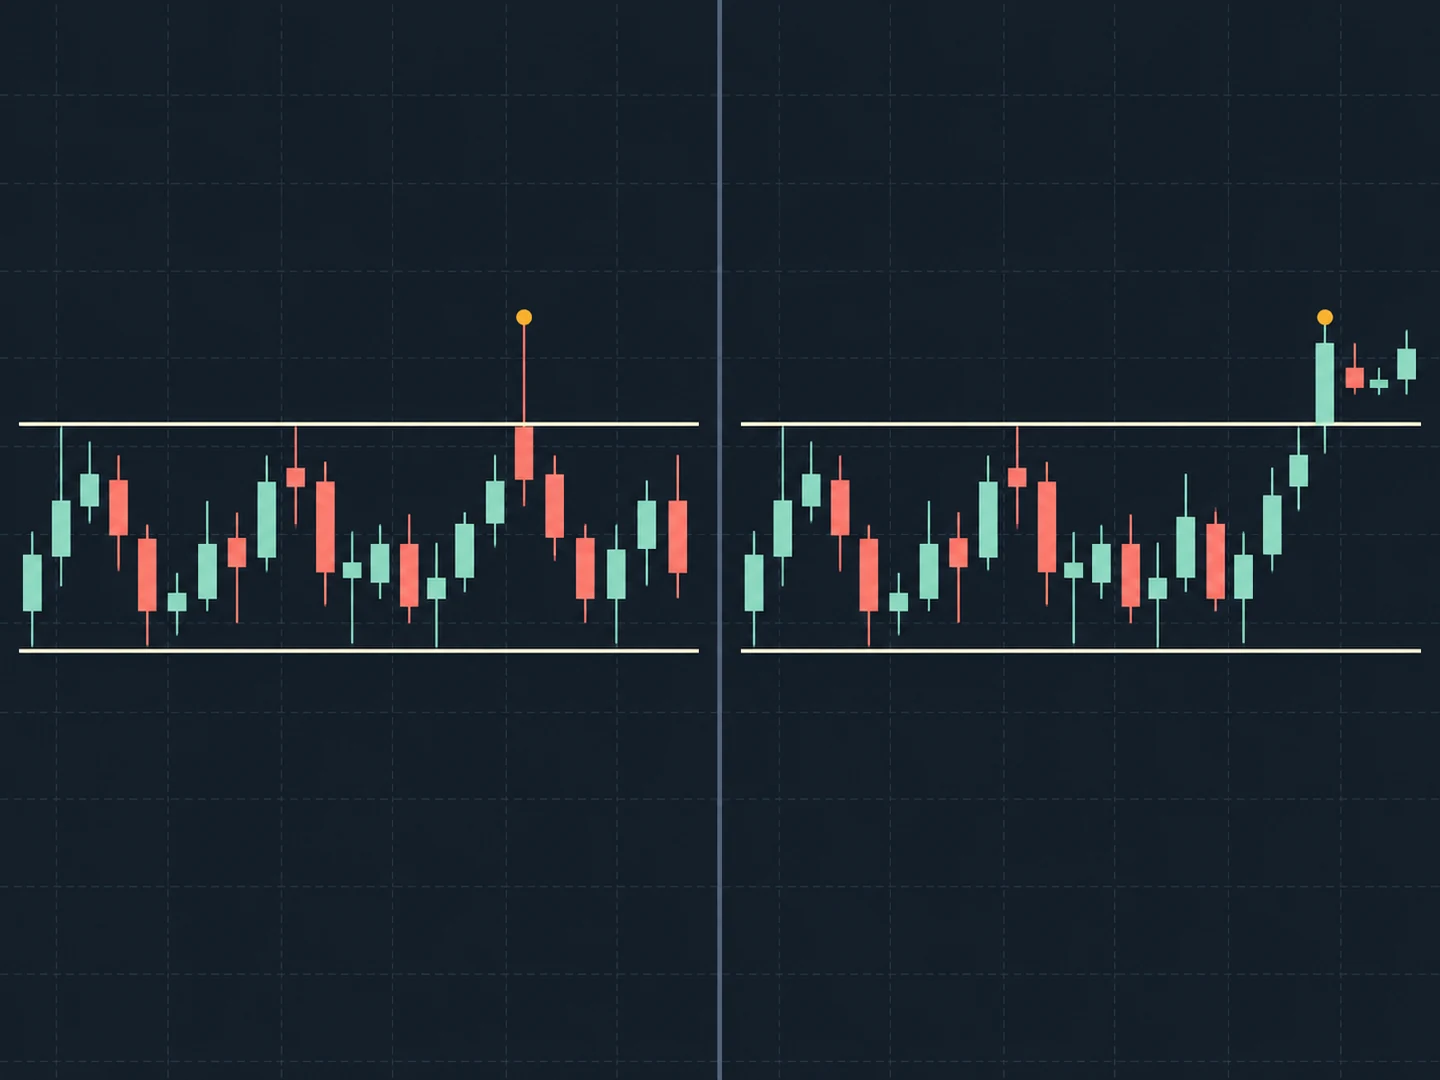
A backtest can report one clean exit even when its source data cannot tell which exit happened first. The ambiguity appears when a historical bar reaches both an upper target and a lower stop. Its high and low show that both prices fell inside the range; they do not preserve the route between them.
The simulator still has to produce a ledger entry, so it applies a fill rule. It may infer an intrabar path from the bar, use smaller bars, or apply a tie policy. The result is conditional on that choice. OHLC alone cannot settle the event order.
What does OHLC keep—and what does it discard?
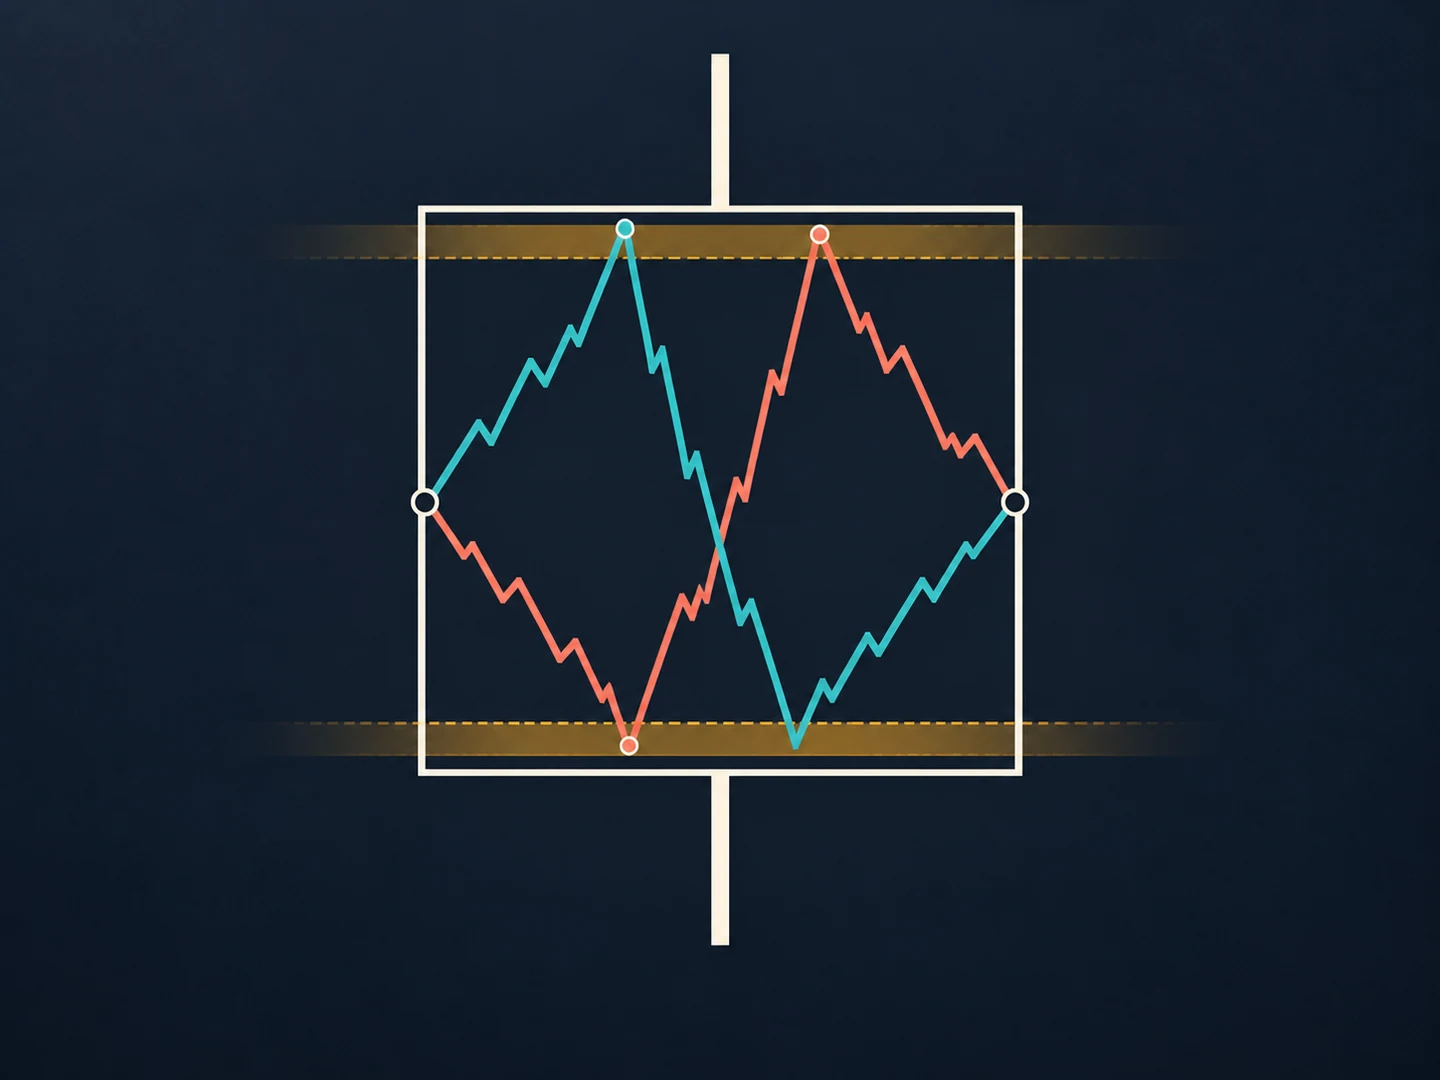
OHLC records four summaries for a period: the opening, highest, lowest, and closing prices. The high and low set outer limits for the prices observed in that interval. They do not show every intermediate update or when it occurred. Many different paths can begin at the same open, reach the same high and low, and finish at the same close.
A chart invites the eye to connect its points into continuous movement. That line is an interpretation unless the underlying feed contains finer-grained observations. For a trade with only one relevant threshold, the missing route may not affect the simulated result. When active exits sit on opposite sides of the open, their order can decide the trade.
A hypothetical bar with two possible outcomes
Consider a clearly hypothetical long position whose two exit orders are already active before a bar begins. Ignore fees and slippage for the moment, and assume in this illustration that whichever exit is reached first fills and cancels the other. Let the bar open at 100, reach a high of 106, fall to a low of 94, and close at 101. Place the upper target at 105 and the lower stop at 95.
One path is open at 100, then up to 106, down to 94, and back to close at 101. The target is crossed before the stop. Another path is open at 100, down to 94, up to 106, and back to 101. The stop is crossed first. Both paths produce exactly the same four OHLC values.
The values are invented only to show what the summary leaves out. The two paths are not claims about equal likelihood, and the example does not estimate how often either sequence occurs. It shows that one OHLC record can be consistent with two different exit orders. If the entry itself also activates inside the bar, the model must account for that timing too; otherwise it may evaluate exits before they were active.
Every simulator has to make its own choice
A simulator that must produce a trade ledger cannot leave every collision unresolved. It needs a rule: infer a deterministic path from the available prices, consult more granular data, apply a specified tie-break, or label the event ambiguous. Each method answers a slightly different question. None adds information that was absent from the original OHLC bar.
These conventions are software-specific. TradingView’s current Pine Script documentation, for example, says its broker emulator infers a default historical path from whether the open is closer to the high or the low, and describes a lower-timeframe option for greater bar detail. That is one documented model, not a universal rule for backtests. The important distinction is between an observed sequence and a sequence the simulator inferred.
A disclosed rule is easier to inspect than a hidden one. Consistent use also makes comparisons more interpretable: changing a tie rule after seeing which version improves the result turns the fill assumption into another research choice that needs to be reported.
More detail narrows the question, but does not erase it
Lower-timeframe bars can resolve a collision when they show the two levels being reached in separate intervals. If both levels still fall inside one smaller bar, that bar has the same missing-order problem at a finer scale. More granular data can reduce ambiguity; OHLC at a smaller interval does not automatically reveal every event inside that interval.
Tick-level records may provide a more detailed sequence of reported prices, but they still do not reproduce every condition needed to establish a real fill, such as queue position or the availability of executable liquidity. Greater detail changes the evidence available. It does not turn a historical simulation into a broker statement.
DayTradeDrill generates intrabar prices and volume from one-minute OHLC bars using its own deterministic event and order-execution rules. Those generated paths are not historical tick data or guaranteed executable prices, and the product does not connect to a live broker or place real orders. A replay can therefore illustrate how a stated model behaves, while the source minute still does not establish the exact sequence within it.
Why one ambiguous bar can affect the report
Under the simplified paired-exit example, choosing the upper-first path instead of the lower-first path changes one trade’s recorded exit. Across a sample, similar cases can affect trade outcomes and any summary built from them, including averages or the shape of an equity path. The size and direction of those effects depend on the data and the surrounding order rules; they cannot be inferred from the candle alone.
The count matters too. A report that says five bars were ambiguous is hard to interpret without saying whether the denominator is all bars, bars with an open position, or trades with both exits active. A collision rate is a property of a defined test, not a freestanding measure of quality.
What a transparent report records
A useful backtest report makes the fill model inspectable before readers compare results. At minimum, it can state:
- Input resolution: name the source bar size and whether lower-timeframe data was used, including any periods without that coverage.
- Order state: identify which orders were active before each bar and whether an entry or exit could be created or changed during it.
- Collision rule: describe the assumed path, tie-break, or unresolved-case policy, and how gaps between bars are treated.
- Scope and sensitivity: give the number of ambiguous cases and a clear denominator, then compare other plausible conventions without choosing one after seeing which looks best.
If alternate conventions produce materially different summaries, that disagreement is part of the result. Hiding it behind one precise-looking equity curve makes the report cleaner, not more informative.
The honest conclusion is conditional
When a bar reaches both exits, OHLC data establishes that both levels were inside the period’s range. It does not establish which one came first. A simulator can still return a useful, repeatable result, provided the report names the path or tie rule that produced it.
The conclusion then belongs to that data resolution and execution model. It describes how the test behaved under stated assumptions; it does not forecast a future sequence, guarantee an executable price, or recommend a trade.
- See how future information can leak into a historical test
- Read why a breakout needs an operational definition
- Interpret trade outcomes beyond one average
Sources and further reading
- Broker emulatorTradingView Pine Script documentation