A performance summary often reduces a difficult period to one number: maximum drawdown. That number describes how far a value series fell from an earlier high to its deepest trough during a chosen window. It does not say how long the series remained below that high. Two histories can reach the same deepest decline yet spend very different amounts of time before revisiting the earlier peak.
This gives drawdown a second dimension. Depth describes magnitude; duration describes time under a prior high according to a stated rule. Looking at both can make a historical description more complete, but neither measure tells a reader what a later path will do. The first step is to define each clock and boundary precisely.
What does drawdown depth measure?
Imagine a hypothetical value series observed over time. At each point, its running peak is the highest value recorded so far. Under one common percentage convention, the drawdown at an observation is the gap between that running peak and the current value, divided by the peak. Maximum drawdown is the largest such gap in the selected window. A dollar-based convention instead records the absolute difference. The two are not interchangeable: the same dollar change can represent a different percentage at a different starting scale.
A maximum drawdown therefore answers a narrow question: what was the deepest peak-to-trough decline in this particular series and window, under this calculation? It does not describe every decline, the order of all gains and losses, or the time spent away from earlier highs. Research on drawdown measures formalizes the peak-to-trough idea and also explores measures based on more than a single worst observation. The chosen calculation should be stated rather than assumed.
What does drawdown duration add?
Duration adds a time boundary to the decline. One practical convention measures the elapsed time from the first observation below a previous peak until the series first reaches or exceeds that same peak again. This is often described as time below the high or time to recovery. Another possible measure starts at the trough and counts only the recovery leg. Those clocks answer different questions, so a report needs to say which one it uses.
A recovery rule also needs an observation basis. Does the series count as recovered when a closing value reaches the earlier high, when an intraperiod value touches it, or when a flow-adjusted account value does? There is no useful comparison if one series uses closing observations and another uses intraperiod highs without saying so. Drawdown-duration research studies time to recover a historical maximum under specific mathematical models; an educational comparison can use a simpler explicit rule without claiming that the model describes every market path.
How can equal depths hide different histories?
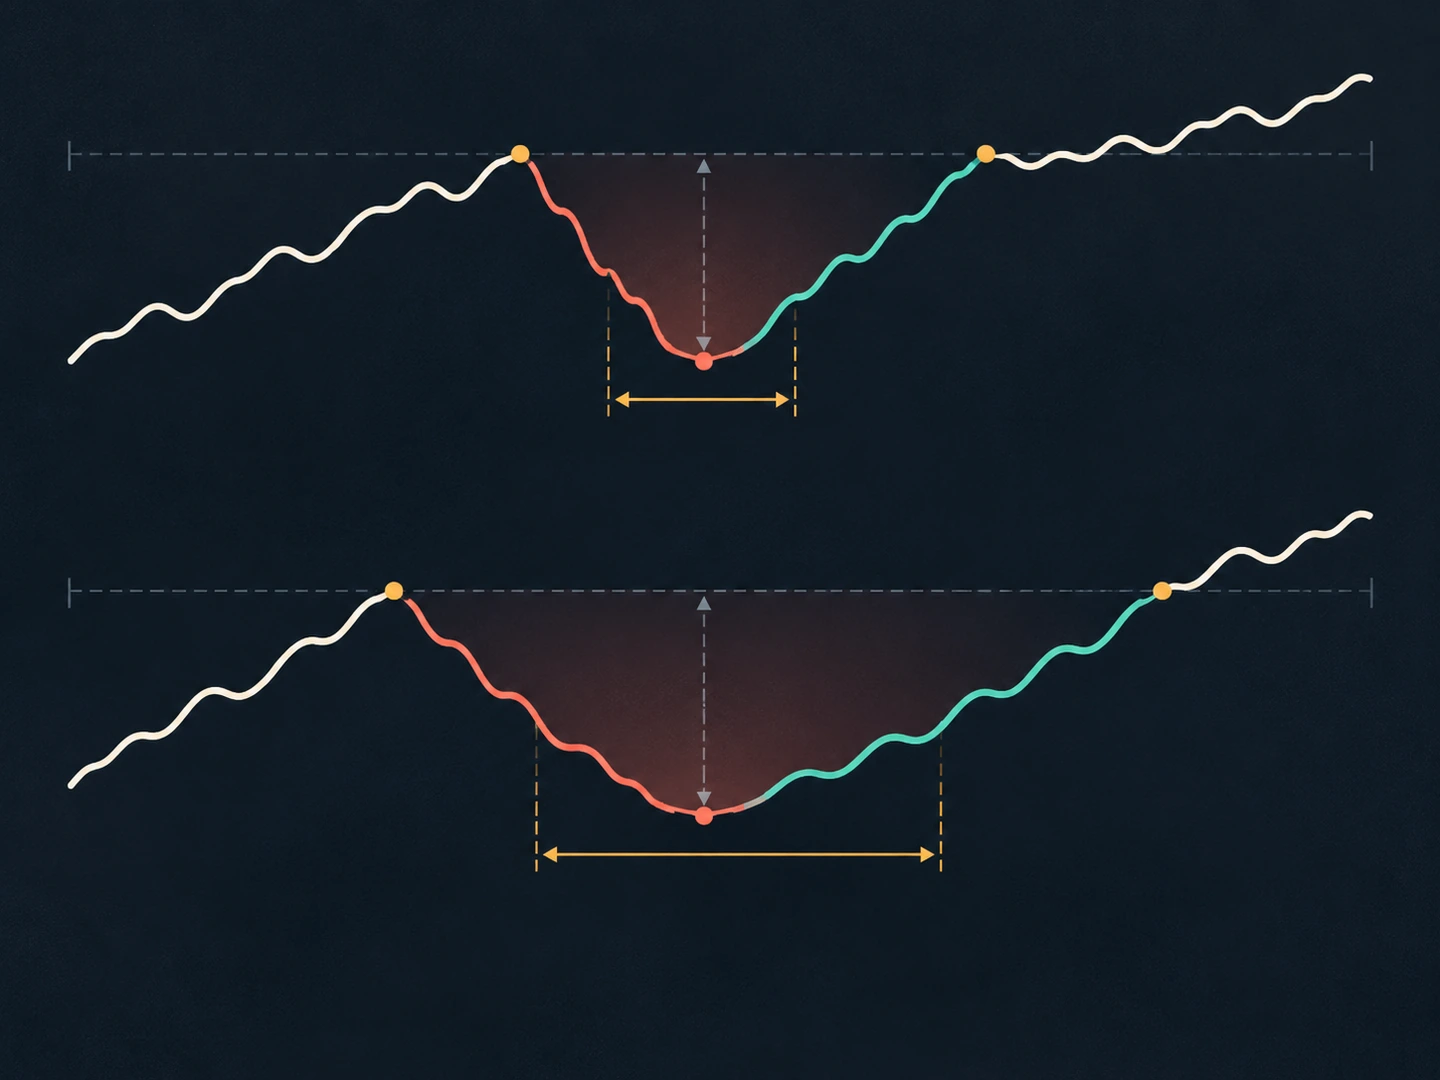
Consider a hypothetical comparison, not a real account or strategy result. Two normalized value series begin at the same prior high. Each later reaches a trough that is twelve percent below that high, using the same calculation. Series A returns to its earlier high after three weeks. Series B does not return for twenty weeks. Their maximum drawdown depths match, while their measured durations differ substantially.
The example is deliberately small. It isolates one distinction rather than estimating how common either path is. A depth-only summary would make the two worst declines look alike. A duration-only summary would hide how far each series fell. Together, the measures describe more of the historical experience, but still leave out the exact path between observations and many other features of the series.
Define the clock before comparing series
A duration number is meaningful only after the data series and the clock have been specified. Several choices can change the result without changing the underlying sequence of market observations:
- Time unit: elapsed calendar days, trading sessions, bars, or trades are different clocks. If observations are irregular, a count of rows is not the same as elapsed time.
- Peak and recovery boundary: record whether the reference is the last high-water mark and whether recovery means reaching or exceeding it.
- Sampling rule: decide whether the series uses closes, intraperiod observations, or another consistent valuation point.
- Series construction: state how fees, withdrawals, deposits, distributions, and other external cash flows are represented. Raw account balances can move for reasons unrelated to investment performance.
- Window endpoints: publish the start and end dates or observations. A peak before the window can change the measured depth and recovery clock.
Comparisons are clearest when both series use the same valuation basis, observation frequency, time unit, and recovery convention. If one history is measured by daily closes and another by individual trades, the number of observations cannot be compared as if each step represented the same amount of time. Converting both to elapsed days may help describe duration, but it does not make the underlying samples equivalent.
What if the sample ends before recovery?
A series may end while it is still below its previous high. In that case, the elapsed time underwater is known only up to the sample endpoint; the final recovery duration is not observed. Treating the endpoint as if recovery occurred there would change the definition. A careful description can label the episode as ongoing and report its elapsed-to-date duration separately from completed episodes.
This also affects summaries of multiple episodes. If only completed declines are counted, a long unfinished episode disappears from the duration distribution precisely because it has not recovered within the sample. That is a selection issue, not evidence that its eventual duration is short. In statistical language, the final duration is right-censored: the observation window ends before the event being measured is seen. The term is useful only if it is explained and applied consistently.
Read depth and duration as separate descriptions
A deeper but brief decline and a shallower but prolonged period below a high are different historical paths. Neither is automatically preferable or worse for every reader; that judgment depends on objectives and constraints outside these two measurements. The numbers are descriptive summaries, not a ranking of traders, systems, or investment choices.
Maximum drawdown also selects one extreme from the chosen window. It can hide several smaller declines, long stretches near but below a high, or changes in the value series between sampled points. Duration has its own blind spots: a single longest episode does not reveal how often declines occurred or how variable their lengths were. Reporting definitions and, when relevant, the individual episodes helps prevent one summary number from carrying more meaning than it can support.
What neither measure can tell you
Depth and duration do not explain why a decline happened, what risks were taken, how liquid the underlying positions were, or whether the sampled values include all relevant costs. They do not show what would happen in a different period. A simulated or historical series remains a record of its inputs and assumptions; it is not evidence that a future recovery will follow the same path.
The useful question is not whether one statistic replaces the other. Ask what peak defined the comparison, how far the series fell from it, how long it remained below it, and whether the episode was complete when the sample ended. Those details turn a bare drawdown figure into a more faithful description of a past path.
- Compare mean and median trade outcomes
- Read about portfolio risk beyond standalone measures
- Review information timing in historical tests
Sources and further reading
- Drawdown: From Practice to Theory and Back AgainarXiv preprint
- On Magnitude, Asymptotics and Duration of Drawdowns for Lévy ModelsBernoulli, 23(1), 432–458