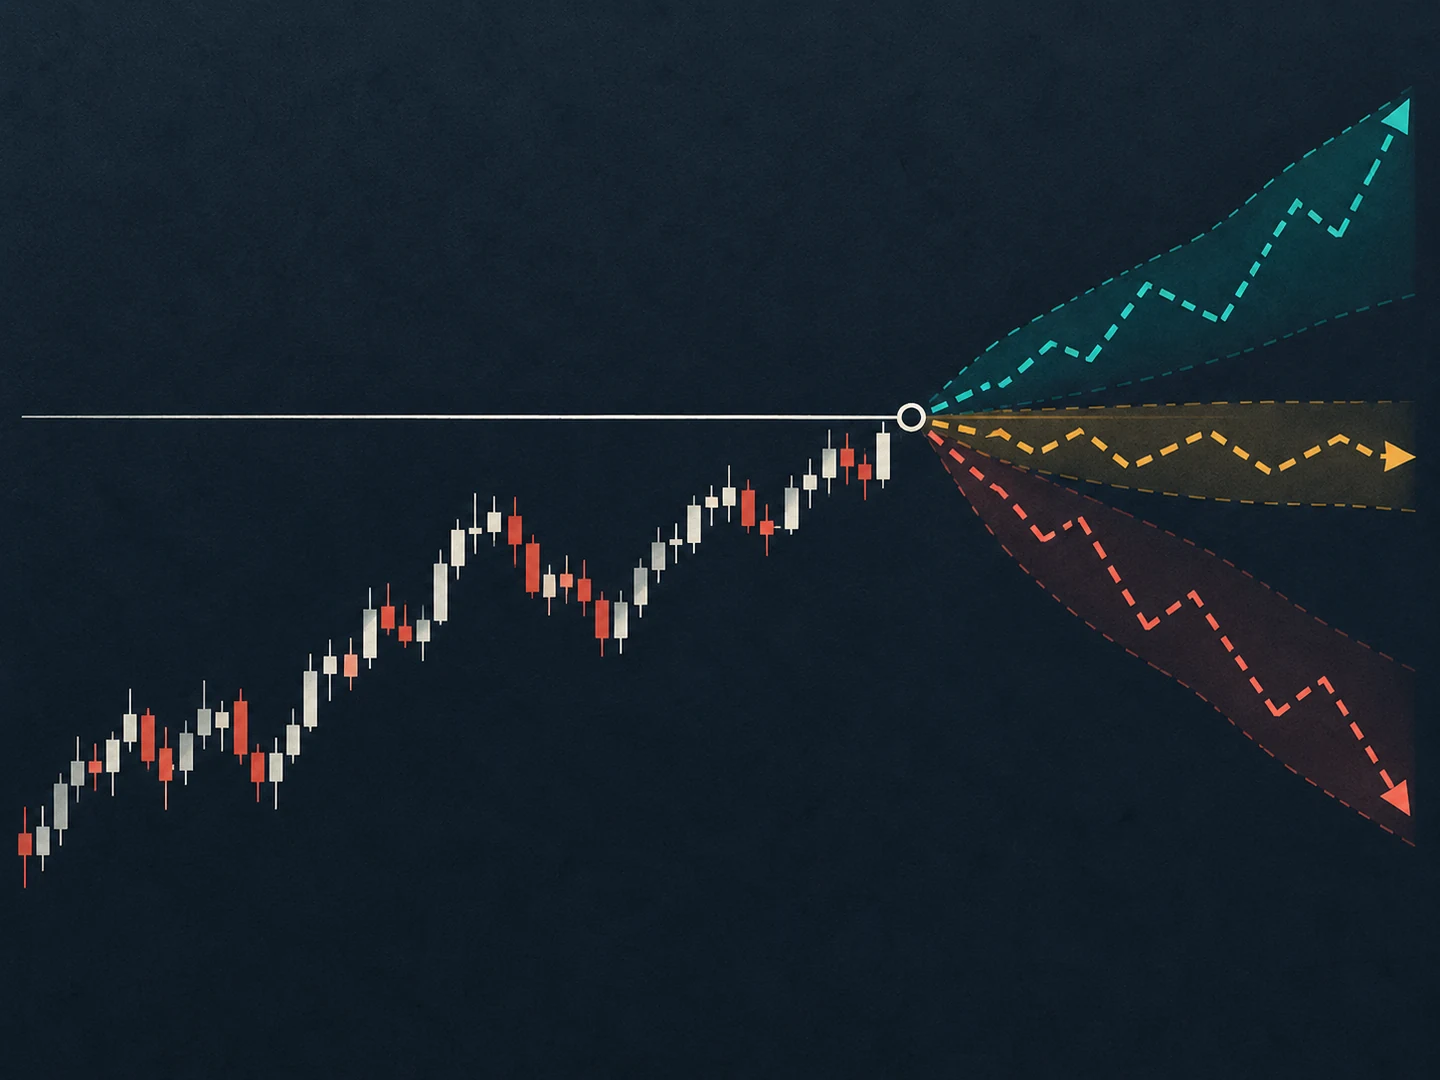
The word breakout sounds like a description of something visible: price moves beyond a range, and the chart appears to show a boundary being crossed. Yet two people looking at the same picture may disagree about where the range began, whether a wick counts, how much distance is enough, or whether the move was confirmed. The disagreement is not merely a matter of drawing style. It reveals that the event has not been defined operationally.
An operational definition states how an observation will be classified. It does not promise that the classification will predict anything. The benefit is narrower and more useful: different reviewers can identify the same cases, preserve uncertainty when evidence is incomplete, and assess a research question without moving the boundary after seeing what happened next.
What boundary defines a breakout before the story?
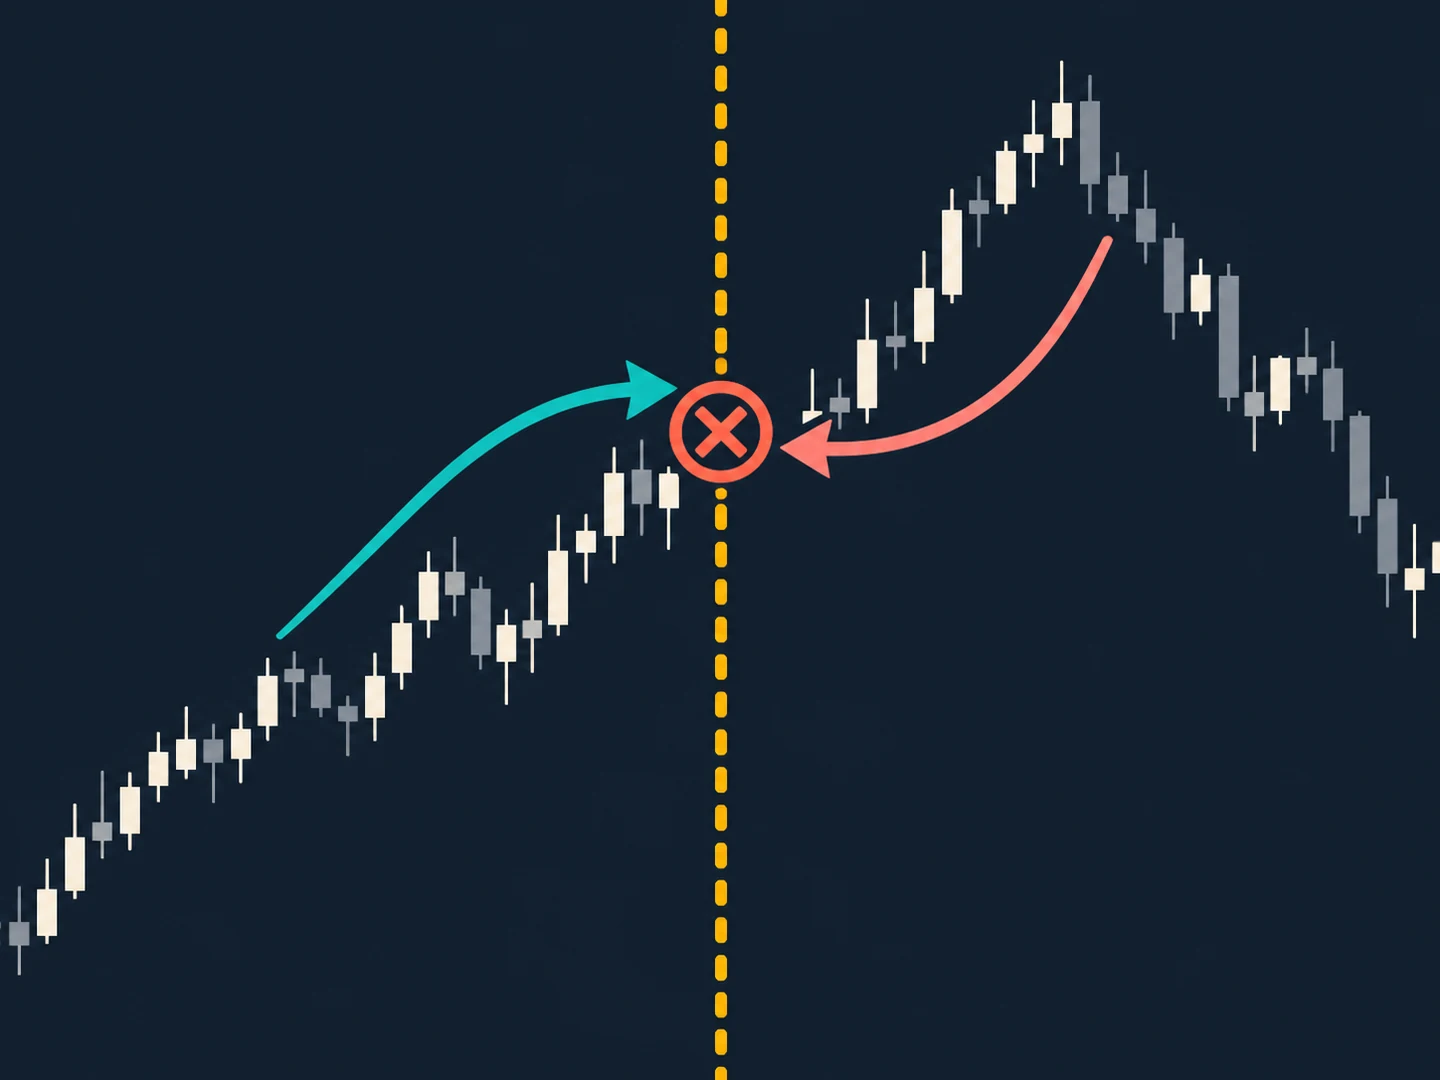
After a strong move, earlier bars can look like a clear base. Before the move, the same bars may have looked like an arbitrary patch of price action. This is a form of hindsight reconstruction: the later outcome influences which past region gets selected as the setup. Unless the range-selection rule is stated before classification, a historical review can quietly favor the examples that look most convincing after the fact.
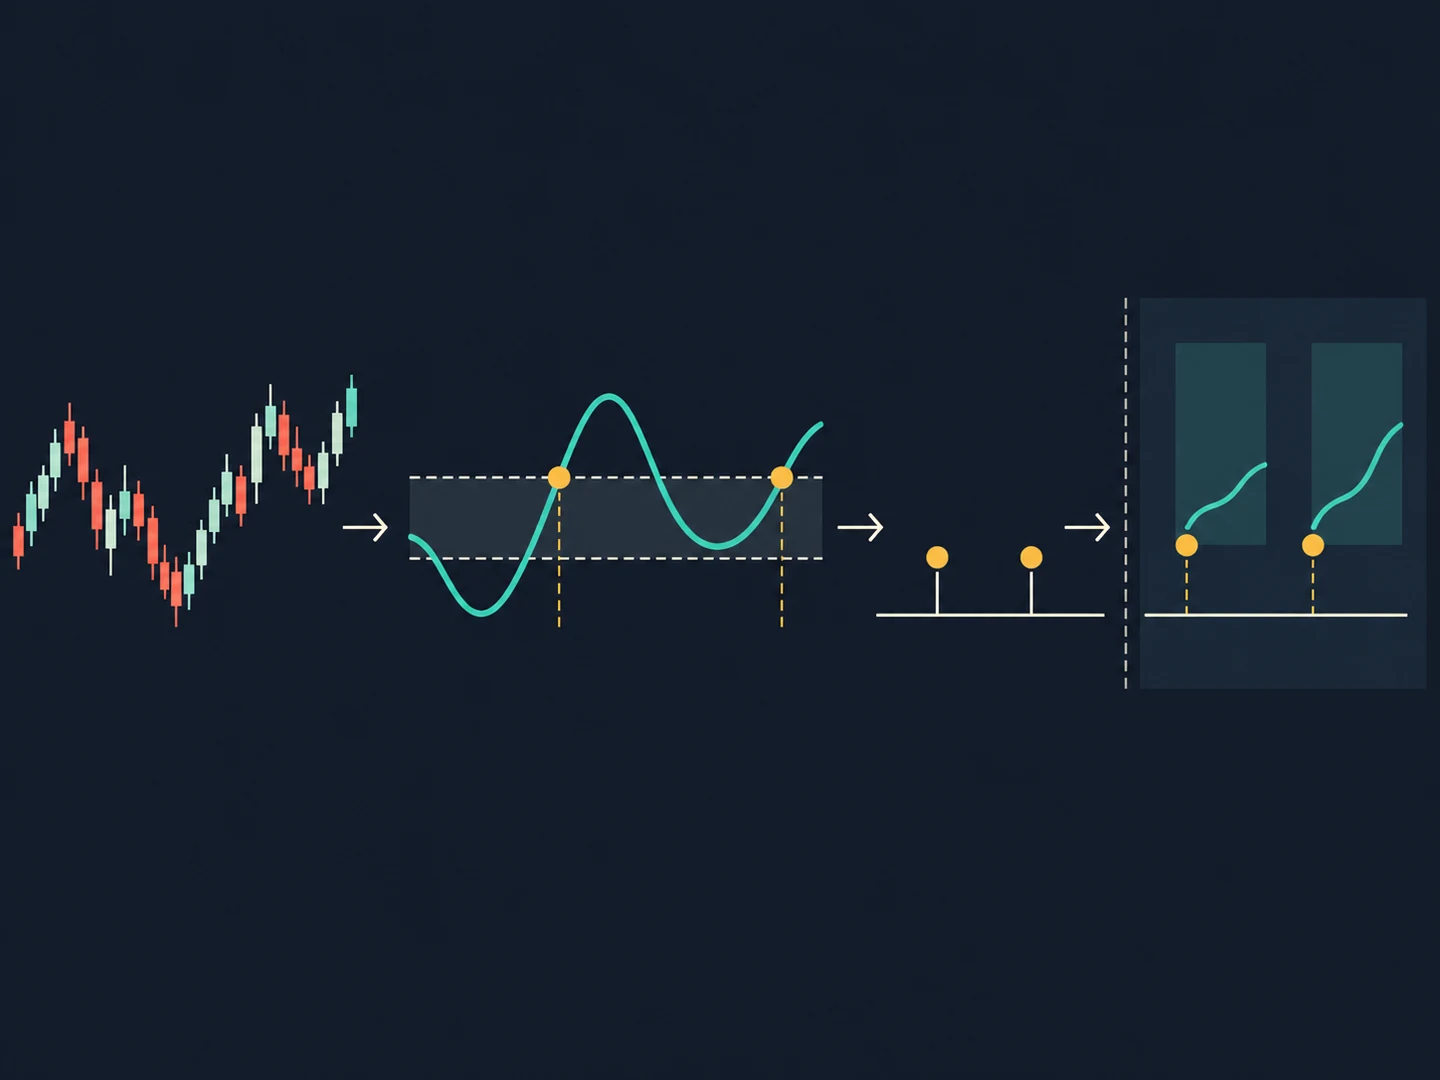
A useful research definition begins with a finite observation window or a reproducible structural rule. It says what qualifies as the upper and lower boundary, whether the boundaries are fixed or updated, and which data are included. A rolling range, a session high and low, and a manually selected consolidation are different constructs. Their labels should not be treated as interchangeable.
Choose what counts as crossing
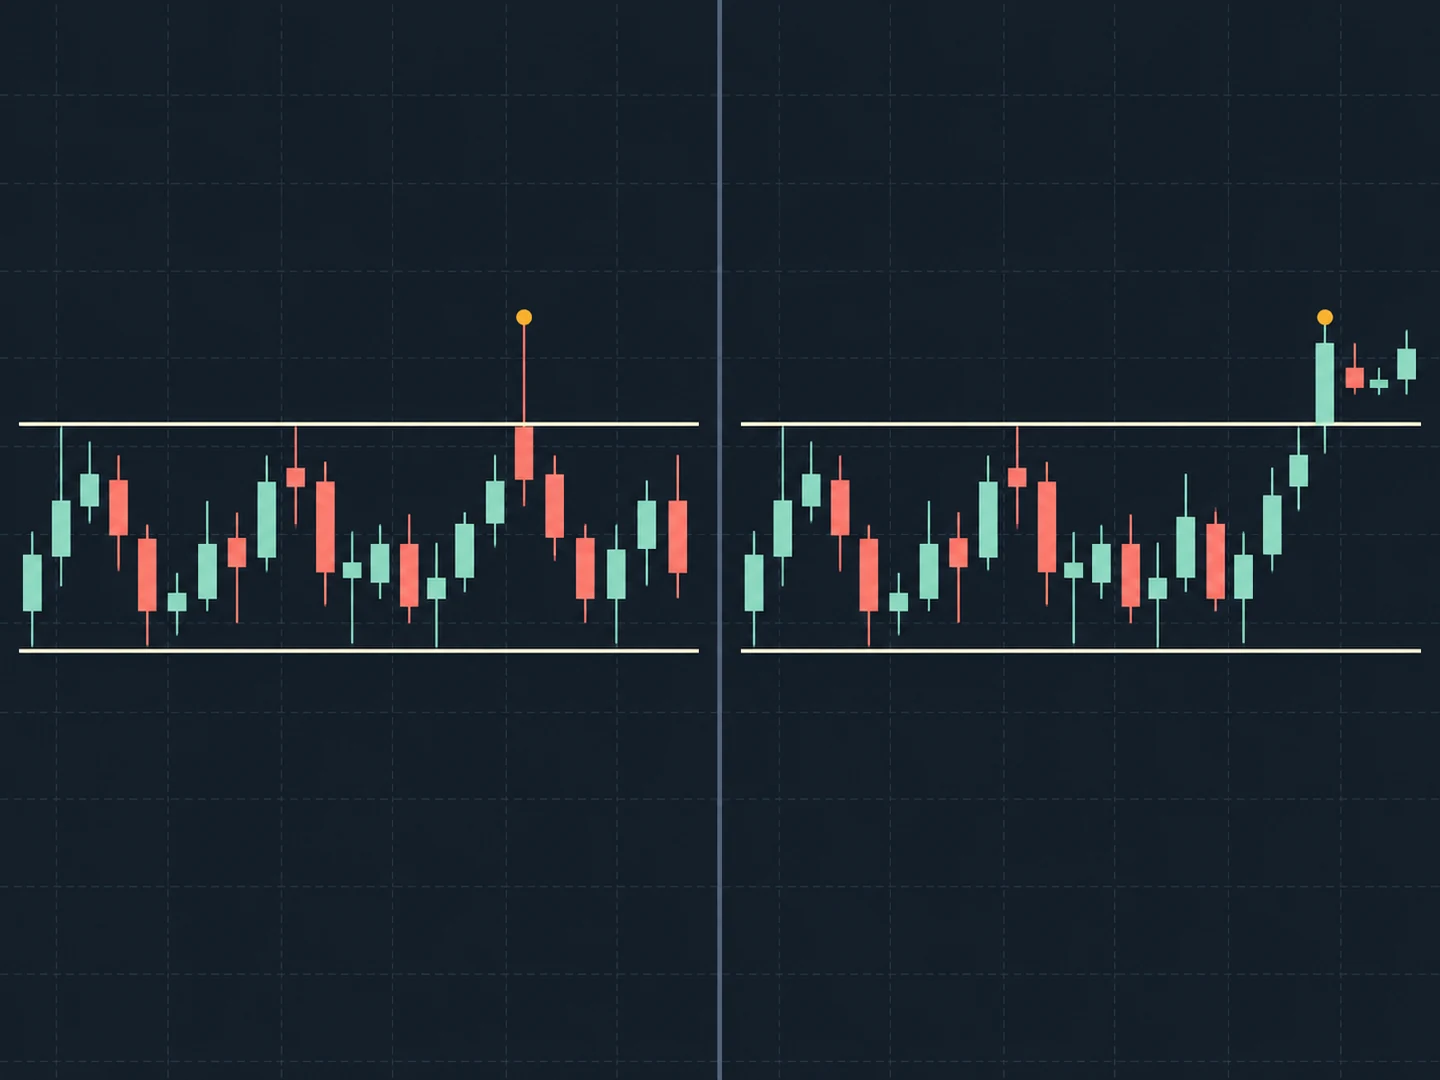
A level can be crossed by an intrabar high or low, by a completed close, or by a sequence of observations. Each convention answers a different question. A wick beyond a line may represent a brief excursion; a close beyond it is a completed-bar condition; repeated closes require persistence. None is universally correct for every research purpose, and selecting one should not be framed as a live-market recommendation.
Specify whether equality counts and whether a tolerance or buffer is applied. A buffer might be expressed in ticks, a fraction of a previously measured range, or another pre-defined unit. If it changes with volatility, define how that volatility is calculated and when it becomes available. Otherwise, a threshold that appears objective can still contain discretionary choices.
- Range construction: which bars or session define the reference region?
- Boundary: how are the high and low calculated, rounded, and updated?
- Crossing: does a wick, close, or multi-observation condition qualify?
- Timing: when is the classification final and available for review?
- Tolerance: is there a buffer, and what exact method sets it?
- Invalidation: what observation means the candidate event did not occur or is no longer in scope?
Keep confirmation separate from the initial event
Researchers often use confirmation to distinguish an initial boundary crossing from later behavior. Confirmation might mean a completed close, persistence for a defined number of observations, a retest under a fixed rule, or another observable event. It should be described as a second-stage classification, not smuggled into the original definition after the path is visible.
Separating the stages allows a dataset to preserve more information. One label can record that a candidate crossing occurred; another can record whether a pre-specified confirmation condition later occurred; a third can describe what happened after that. This avoids forcing a complex sequence into a single yes-or-no tag and makes it possible to ask which stage the research question concerns.
Define failure and ambiguity as carefully as success
If a move returns inside the range, the reviewer needs a rule for how that event is recorded. Does any return invalidate the classification, or does it remain a historical crossing with a separate outcome label? What if data are missing around the boundary? What if the bar opens beyond the level after a gap? These edge cases can dominate disagreement if only successful-looking examples are specified.
A classification system can include at least four states: not observed, candidate crossing, confirmed under the rule, and indeterminate because required data or context are unavailable. A failed later outcome should not erase the fact that a crossing occurred if crossing is the event being measured. Conversely, a crossing should not be relabeled confirmed merely because the subsequent chart looked favorable.
Separate the pattern from an explanation
A boundary event is observable under a rule; explanations for it are hypotheses. Statements about trapped participants, supply and demand, institutional intent, or likely continuation require evidence beyond the geometry of a chart. Such explanations may be explored, but they should not be presented as facts inferred automatically from a line being crossed.
This distinction improves both teaching and analysis. The dataset can first record what occurred, then separately record a hypothesis and the evidence that would support or contradict it. A reviewer can disagree with the explanation while still agreeing on the event classification. That makes discussion more precise and less dependent on persuasive chart annotations.
Prevent the definition from moving during review
Write a short protocol before labeling a large historical sample. Include the range rule, crossing criterion, observation timing, confirmation stage, edge-case policy, and intended outcome measure. Test it on a small group of cases that includes visually clear and ambiguous examples. If reviewers disagree, revise the rule and preserve the version history rather than silently adjusting each chart.
A second reviewer can classify a subset without seeing later outcomes. Agreement on the same cases does not prove that the event has predictive value, but disagreement shows that the definition needs work. If the rule is changed after a full historical review, the reviewed sample has influenced the revision; treat the revised analysis accordingly and avoid calling the same sample independent confirmation.
Record the observation path
For every candidate event, retain the timestamp, input interval, range boundaries, rule version, and the information visible when the classification was made. If a chart is replayed, later bars should remain hidden until the initial observation is recorded. A screenshot can help explain a case, but it should accompany structured fields rather than replace them.
Historical charts may also use different data sources, session definitions, adjustments, or aggregation conventions. Those differences can shift a boundary or change whether a bar appears to close beyond it. Record enough context for a reviewer to understand which observations were used and what limitations apply.
A pattern label is not an outcome claim
Once classifications are consistent, a researcher may examine what followed under a defined measurement window. That is a separate question with its own choices: outcome horizon, return convention, costs, overlapping events, comparison group, and missing cases. A pattern's historical frequency or average follow-through is not a forecast, and an attractive result in one sample does not guarantee recurrence.
A careful report states the event definition first, then the sample and outcome measure, then the limits. It includes false starts and ambiguous cases rather than showing only examples that fit a narrative. This order makes it easier to distinguish a reproducible visual category from a statistical claim and a decision rule.
Sources and further reading
- Execution modelTradingView Pine Script documentation