A technical indicator can look precise because it is rendered as a line, histogram, color, or marker. Precision of display is not the same as precision of meaning. The calculation may be well-defined while the interpretation remains vague: a line crosses another line, a value looks high, or a marker appears near a turn. Before such an observation can be evaluated, the researcher must specify what exactly is being calculated and what claim the display is supposed to support.
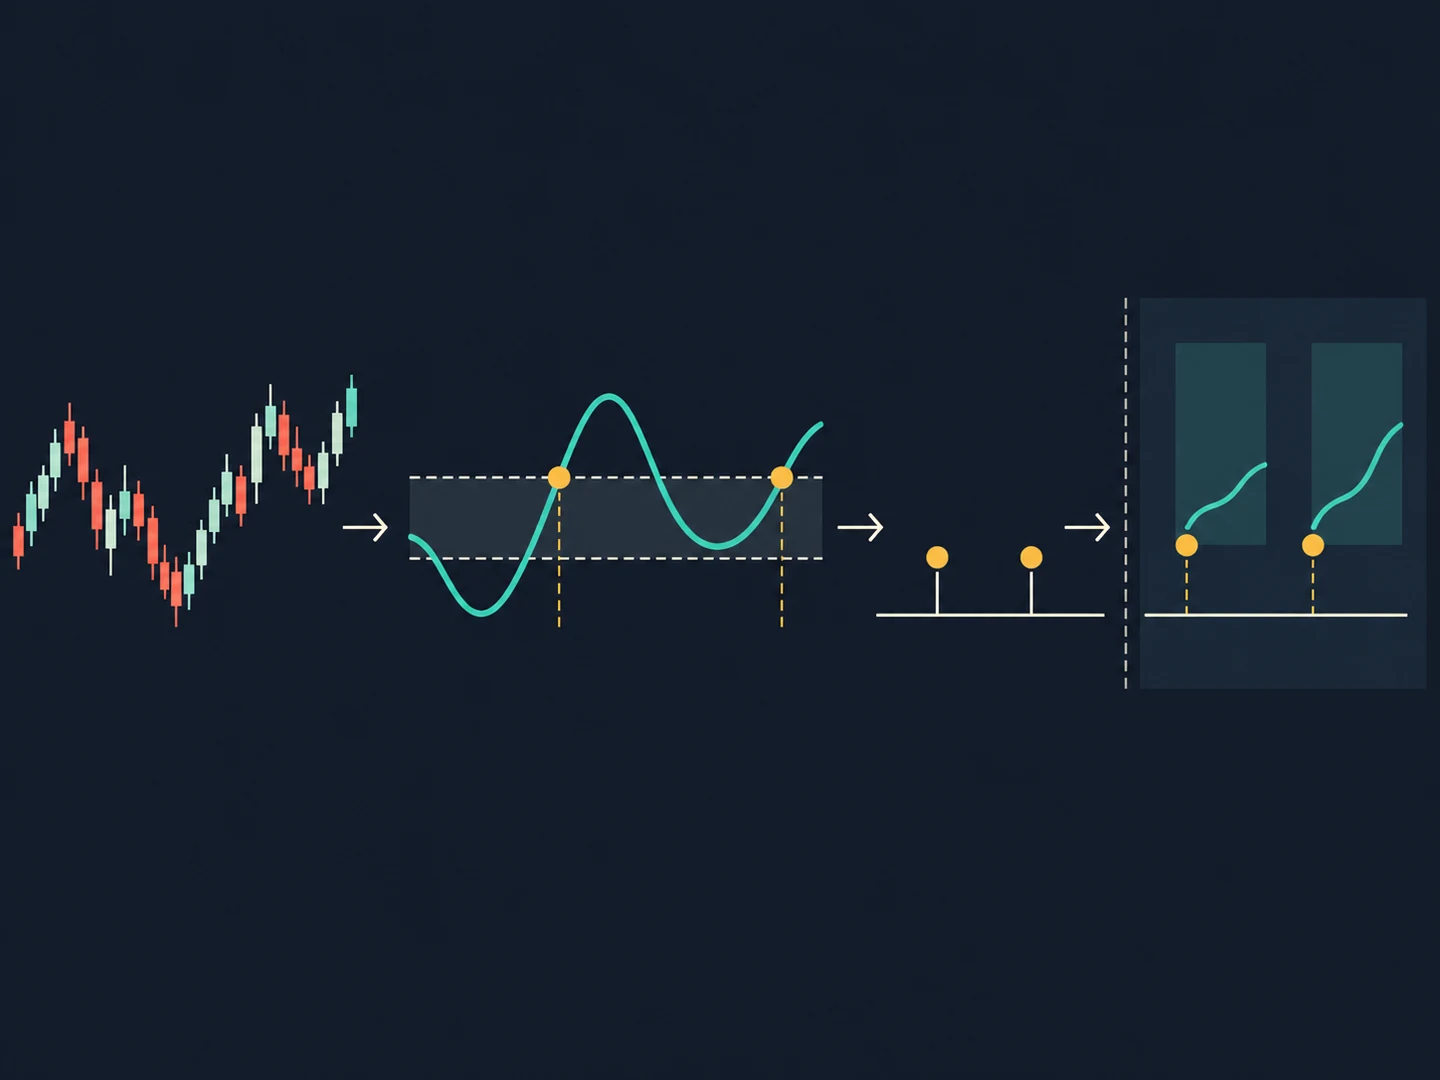
This distinction is central to quantitative research. An indicator is a transformation of input data. A signal is a rule that classifies information at a defined time for a defined purpose. An entry, exit, or position-sizing instruction is a further layer still. Combining these layers in casual language makes it easy to mistake a visual cue for a complete method.
Why start with the indicator calculation, not its label?
Names such as trend, momentum, or overbought summarize a family of ideas, not a specification. Document the input series, lookback, smoothing method, initialization, and behavior when data are missing. Two implementations can share a familiar label and still differ because one uses a close, another uses a typical price, or their warmup rules and session boundaries differ.
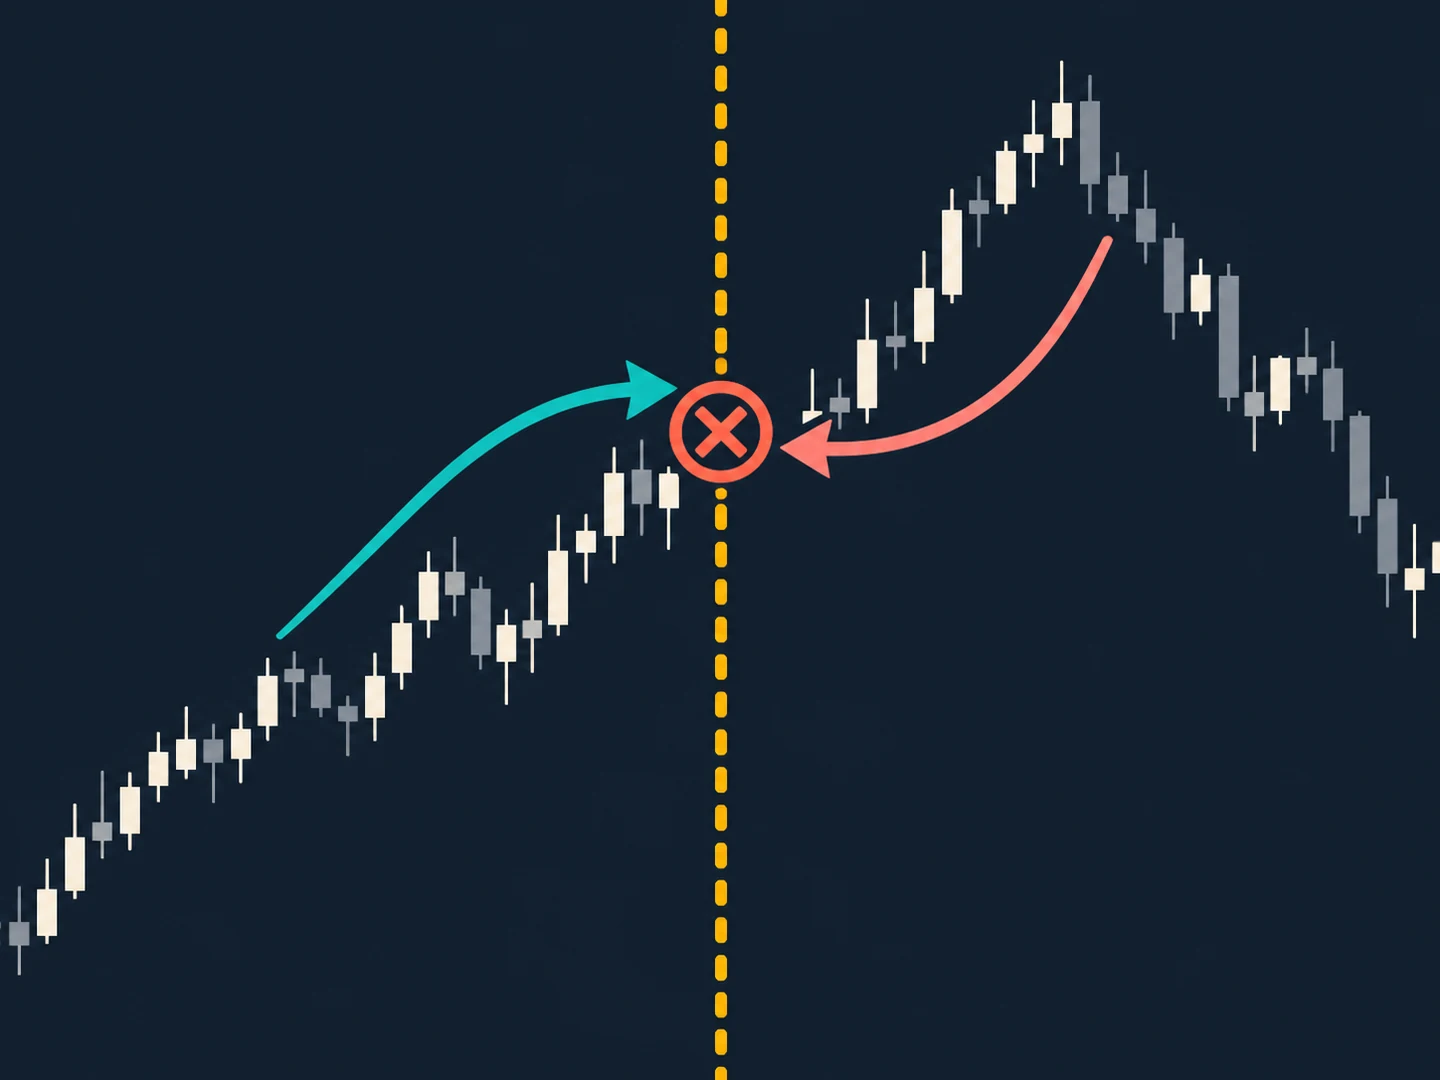
A calculation also needs a time convention. Is the value updated during a forming bar or only after it is complete? Does the rule use the value from the current observation or the previous completed observation? If historical data are revised or aggregated, which version is available at the decision timestamp? A value that changes before a bar closes cannot be treated as though its final value were known earlier.
TradingView's Pine documentation describes an execution model in which scripts can execute repeatedly as realtime data updates and can behave differently between historical and realtime bars unless calculations are designed carefully. That is a platform-specific reminder of a broader research principle: record when a value becomes final and available, rather than inferring availability from how a historical chart is drawn.
Turn an interpretation into a rule
A testable signal answers a narrow question with a reproducible condition. For example, a researcher might ask whether a completed value is above a fixed threshold, whether two completed series have crossed, or whether a condition has remained true for a specified number of observations. Those are examples of rule forms, not recommendations to use any particular indicator or threshold.
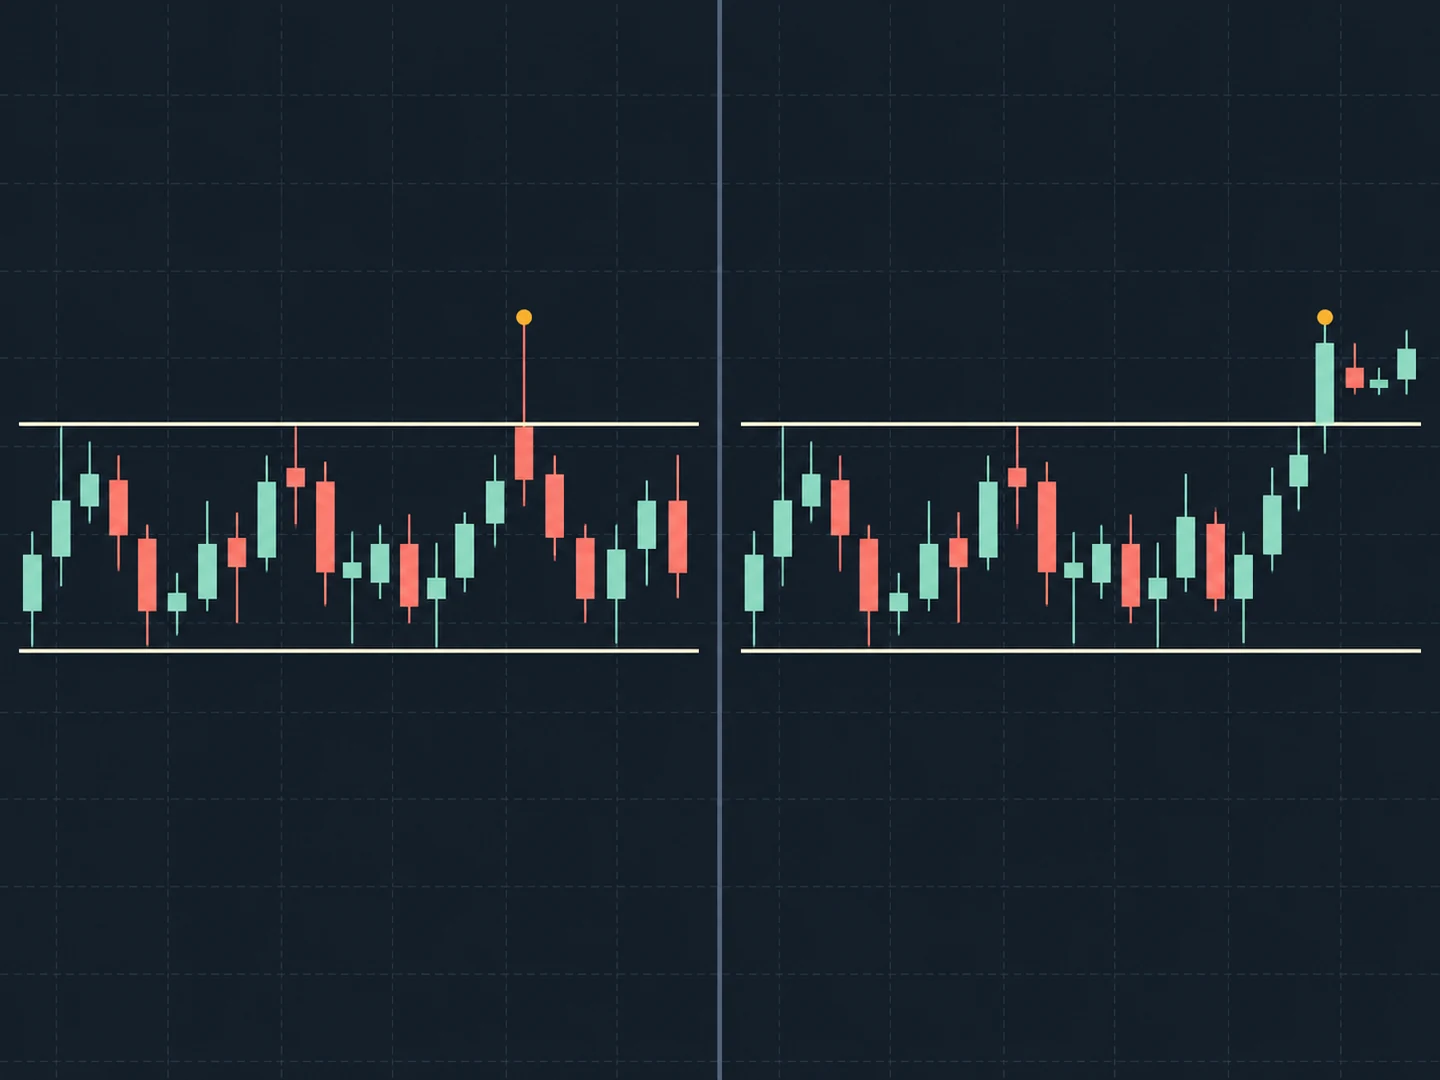
A complete definition states the comparison, the timing, and the output. It should explain whether equality counts, whether the event fires once or remains active, what happens when data are missing, and whether an opposite event resets the state. If two careful readers could code different behavior from the description, the rule is not yet operational.
- Input: which series, source, interval, session, and adjustment convention are used?
- Availability: at what timestamp is each input complete and usable?
- Comparison: what exact threshold, crossing, persistence, or ordering condition is tested?
- State: does the event occur once, remain true, or reset under a defined condition?
- Exceptions: how are missing values, warmup, gaps, and boundary bars handled?
- Output: is the result a label for analysis, or is it being connected to another decision layer?
Writing the rule in plain language before translating it into code is useful. A second reviewer should be able to classify a small set of hand-worked examples without needing to guess what the author meant. Code then implements the specification; it should not silently create the specification through incidental defaults.
Keep the signal separate from an action
Even a perfectly reproducible signal does not establish that an order should be placed. A research signal might be a binary label, a score, or an event used to compare later observations. An action layer introduces additional assumptions about exposure, order type, execution timing, costs, constraints, and the objectives of the person or system using it.
This separation makes experiments easier to diagnose. If a simulated result changes, a researcher can ask whether the calculation changed, the signal definition changed, or the execution assumptions changed. If all three are entangled in one indicator script, a favorable result may be impossible to attribute and a failure may be impossible to explain.
Freeze the rule before evaluating it
A threshold chosen after inspecting many historical charts has already been influenced by those charts. That does not make exploration illegitimate; it changes what the sample can establish. Treat the observations that inspired a definition as development material. Preserve the rule version, parameter choices, and reason for each change, then evaluate a frozen specification on observations not used to create it when the research design permits.
Searching across many indicators, lengths, thresholds, markets, and time periods creates many opportunities to find an appealing historical pattern by chance. Reporting only the most attractive combination hides the breadth of the search. Keep an experiment log that records unsuccessful variants as well as the final candidate, and describe how comparisons were selected.
A holdout period is not a magical cure. Repeatedly consulting it turns it into another development set. Data overlap, dependence, changing market structure, and model selection can all affect interpretation. The point is not to claim that a single split proves future validity, but to make the information path visible and to avoid presenting an in-sample discovery as an independent confirmation.
Test timing and execution assumptions
Once the calculation and signal are specified, test how the rule is aligned with data. A value derived from a bar's close cannot usually be used as if it were known before that close. A signal may only be evaluated after its inputs are available; any simulated order must follow an explicit timing convention. Shifting a series by one bar can change the result materially, so alignment deserves its own tests rather than visual inspection alone.
Execution assumptions are another layer. A historical signal on a bar does not reveal the exact price at which a real order could have been filled. Spread, slippage, latency, queue position, liquidity, and market impact may be absent or approximated. For example, DayTradeDrill intrabar replay prices are simulated from one-minute OHLC data rather than actual tick-by-tick order-book events or guaranteed fills. Any practice or evaluation should state that boundary plainly.
Check the implementation against examples
Build a small validation set with ordinary cases and edge cases: the exact threshold, one value just above it, missing data, the first warmed-up value, a session transition, and a forming versus completed bar. Calculate expected results by hand where possible, then compare the implementation. These checks catch off-by-one errors and hidden state transitions that a full backtest can obscure.
It is also useful to test invariants. If a signal is defined only from completed data, revealing a later bar should not alter its earlier classification. If two implementations claim to follow the same written rule, they should agree on the validation set. Disagreement is not a reason to choose whichever output looks more plausible; it is a prompt to clarify the specification.
Describe what the signal does not say
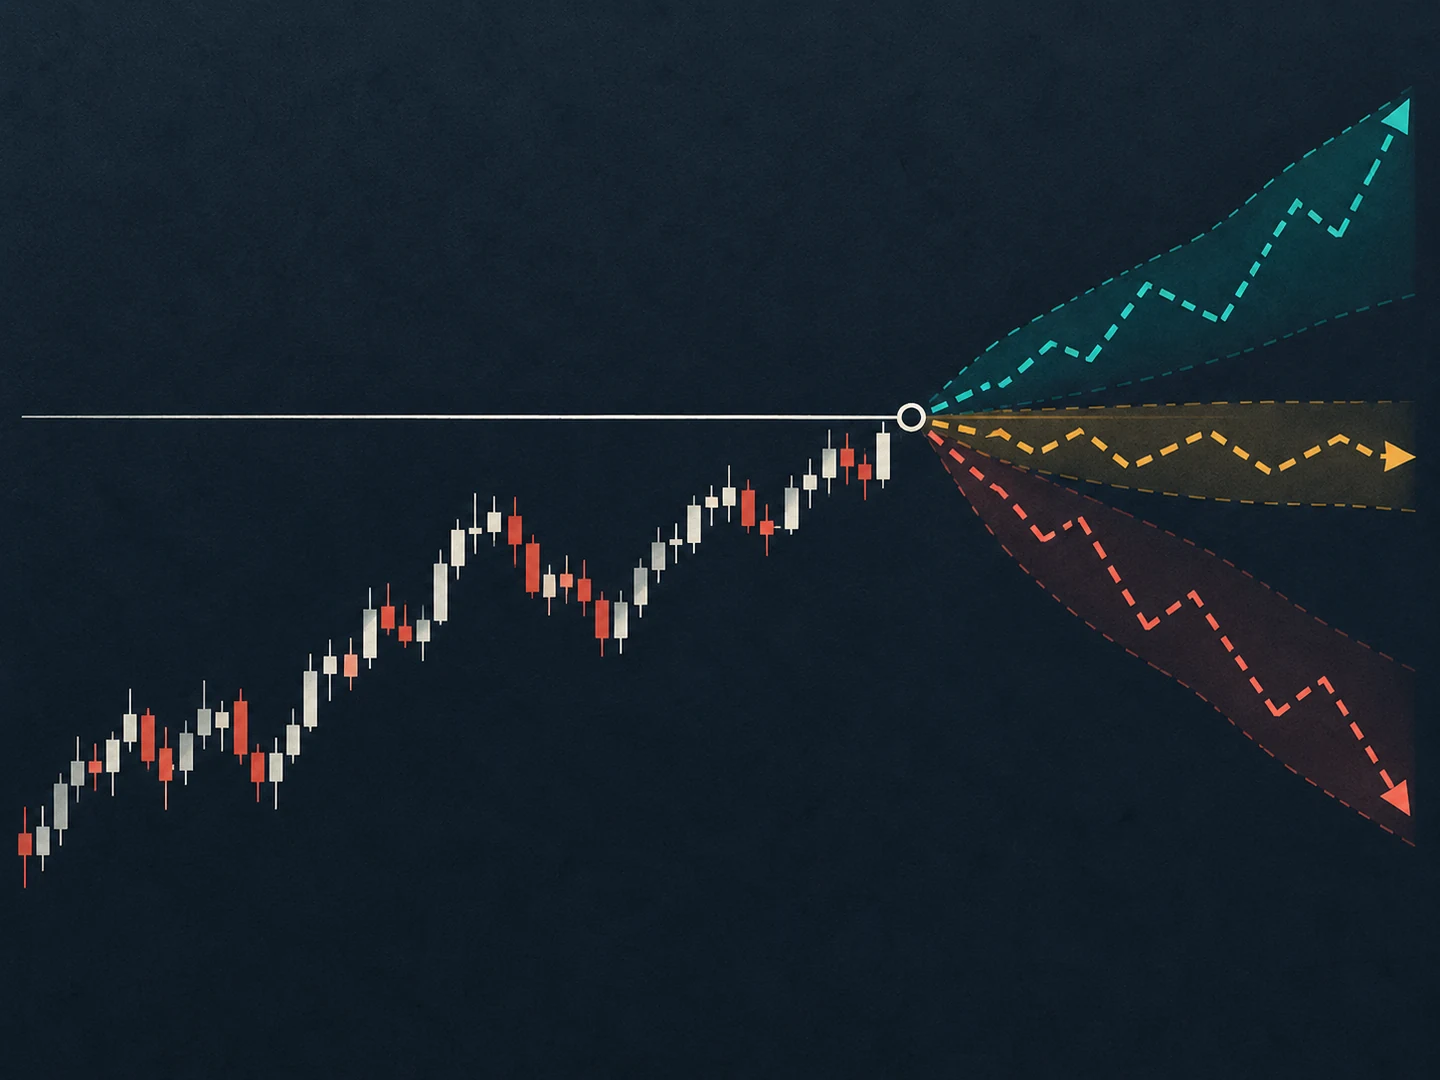
A well-defined signal can be useful as a research variable while remaining limited. It does not prove causation, persistence, profitability, or suitability. A chart that marks past conditions is descriptive. An out-of-sample test adds evidence only within its data and assumptions. Neither step turns the output into a forecast of the next market move.
A good report therefore states the intended question, input definitions, timing, version, search process, evaluation sample, and execution limitations. Include cases where the signal did not behave as expected. The more precise the boundary, the easier it is for another researcher to reproduce the result without inheriting the author's unspoken interpretation.
- Audit information timing in historical tests
- Define a breakout before evaluating it
- Review portfolio interaction and assumptions
Sources and further reading
- Execution modelTradingView Pine Script documentation