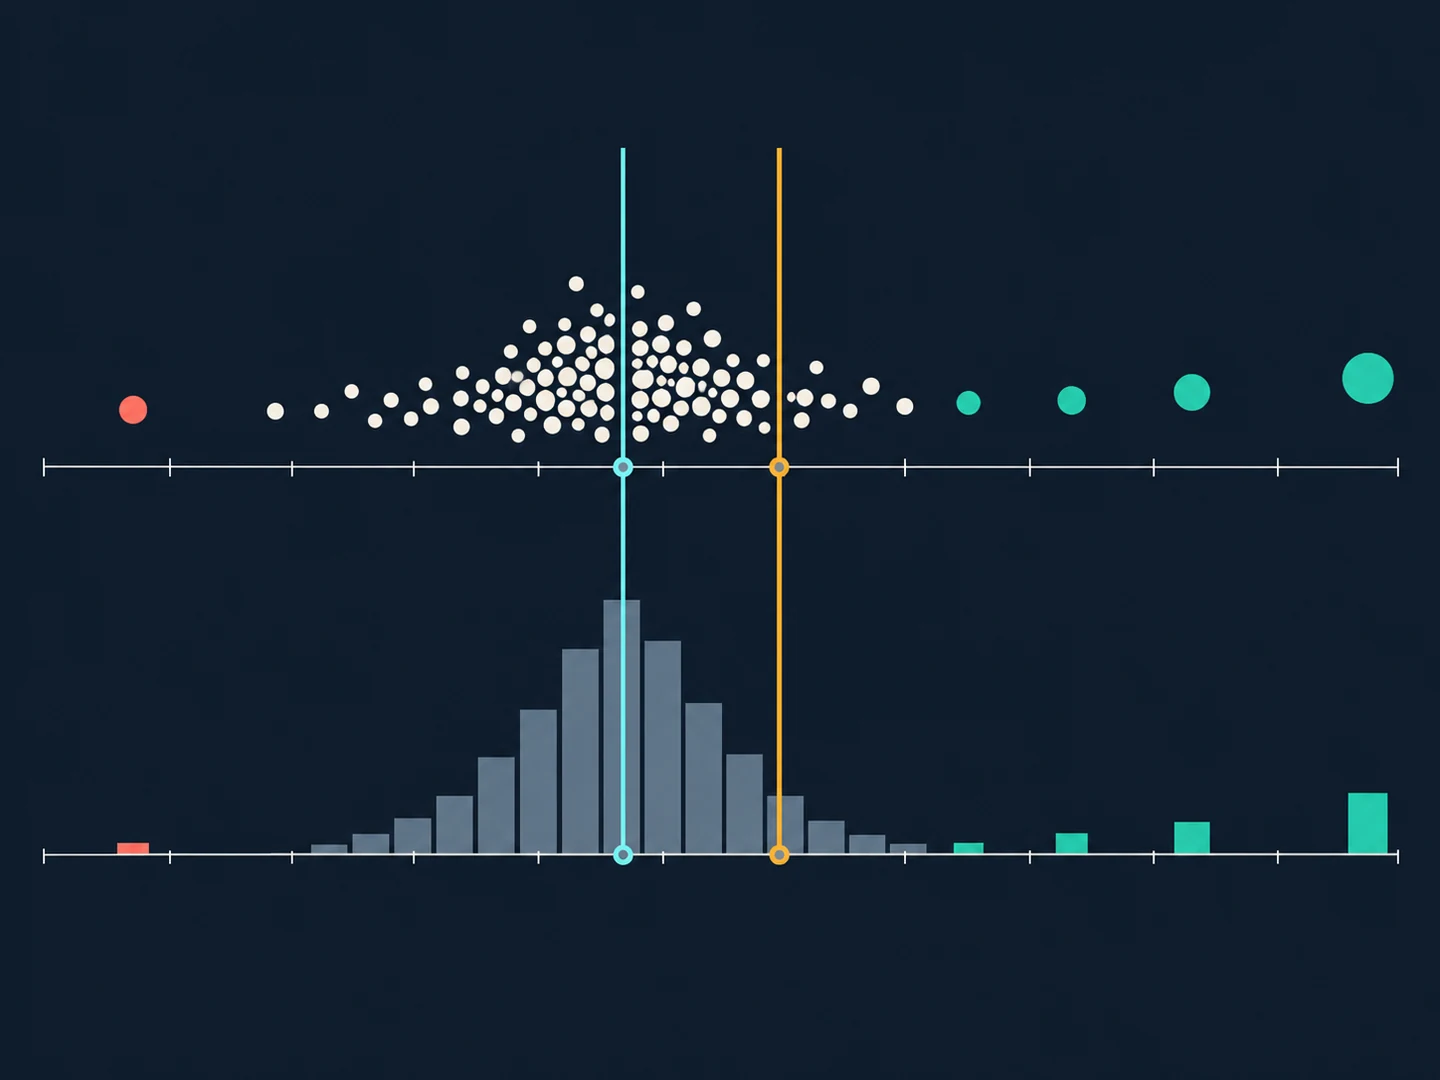
After several wins, the next opportunity can feel unusually attractive. After several losses, the same process can suddenly seem broken. In both cases, the most recent outcomes occupy the foreground while the longer record fades. That shift in attention is a practical form of recency bias, but noticing it does not tell us whether the process has changed.
A streak can arise in a stable random process, reflect dependence between outcomes, or coincide with a change in conditions or execution. The same short sequence is compatible with several explanations. Treating it as a signal before separating those possibilities can turn emotion into a new rule without enough evidence.
What can recency bias tell you about a streak?
In everyday review, recency bias means that recent experiences receive disproportionate weight when someone forms a judgment. It describes an attention and inference problem, not a law that recent observations are irrelevant. New information can matter. The challenge is to identify what changed and whether the record supports that interpretation.
A trader may see a short run of outcomes and conclude that a method has become reliable or has stopped working. Both claims require a comparison with a defined baseline. How many observations are included? Were they selected because they formed a striking sequence? Did the measurement rule stay constant? Without answers, the label streak can be more vivid than informative.
Small samples do not need to resemble the whole
People often expect a small sample to look like a balanced miniature of the process that produced it. Tversky and Kahneman described this intuition as a belief in the law of small numbers. In practice, short samples can look unusually clustered or unusually alternating. A short sequence alone therefore cannot show whether the underlying process changed.
The denominator also matters. Under a hypothetical independent process with a one-half chance of either outcome, one particular pre-specified sequence of three losses has probability one in eight. Searching a much longer record for any run of three losses asks a different question, because there are many possible starting points. Finding a streak after scanning the data is not equivalent to predicting its location in advance.
Do not replace one fallacy with its opposite
The careful conclusion is not that streaks never contain information. It is that a short run cannot answer the question by itself. Research on the hot-hand literature has shown that finite-sample properties can complicate how streak statistics are interpreted, including bias in some conditional comparisons. That correction does not prove that a streak is present in every market process or that it can be exploited.
A loss run does not mean a win is due, and a win run does not mean another win is likely. Those statements confuse a sample description with a probability claim. Before proposing persistence or reversal, define the outcome, the eligible observations, the comparison baseline, and the test. If the rule is written after seeing the streak, mark the sequence as exploratory rather than confirmatory.
Separate outcome streaks from process drift
A sequence of results is not the only thing that may be changing. Execution may drift, data quality may differ, the rules may have been applied inconsistently, or the environment may no longer match the assumptions. These are hypotheses to examine, not conclusions to infer from a colored run of outcomes.
- Outcome: what was measured, net or gross, and over which fixed window?
- Process: did the written rule, data source, or execution assumption change?
- Context: were the observations drawn from comparable conditions, or did the sample mix unlike periods?
- Selection: was the streak noticed before testing, or found after scanning many intervals?
- Alternative: what evidence would support a different explanation?
A journal can preserve both the outcome and process evidence. Keep the original rule version, mark exceptions, and note whether the observation was part of a pre-defined review or an idea generated after the fact. This makes it possible to ask whether a change is worth investigating without immediately modifying the method.
Use a review protocol before changing a rule
When a streak feels urgent, slow the conclusion down. Write the concern in one sentence, state the time window and measure, and compare the sequence with the broader sample using the same definitions. If the rule was selected after seeing the sequence, reserve new observations or a separate period for a later check. Reusing the same evidence to create and validate a claim gives the claim an unfair advantage.
A protocol does not require ignoring discomfort or waiting for a magic sample size. It requires naming what would count as evidence and what remains uncertain. If the question is about process adherence, review process fields rather than asking only whether the last results were positive. If the question is statistical, use a method appropriate to dependence, selection, and the number of comparisons made.
Keep the emotional record separate from the statistical claim
A recent run can affect attention even when it does not change the underlying process. A journal entry might say that the last outcomes made the next decision feel more urgent, then record what the written plan required at that moment. That is useful self-observation. It should not be rewritten as proof that the market was in a special state.
Avoid turning a single entry into a personal diagnosis. Describe the cue, the thought, and the observable choice in plain language. Repeated records may suggest a review question, but they still need context and an appropriate comparison. This keeps psychology notes respectful and concrete rather than labeling the trader as inherently fearful, overconfident, or undisciplined.
A streak is a prompt for a better question
The most useful response to a vivid run is often not a prediction but a narrower question. Did the sample definition change? Were observations independent? Did the process drift? Was the sequence discovered only after many opportunities to search? A clearer question can be tested. A dramatic chart annotation cannot substitute for that test.
- Journal sessions when no trade occurred
- Compare mean and median trade outcomes
- Consider co-movement across a portfolio
Sources and further reading
- Belief in the Law of Small NumbersTversky and Kahneman · Psychological Bulletin
- Surprised by the Hot Hand Fallacy? A Truth in the Law of Small NumbersMiller and Sanjurjo · Econometrica